
Why Visual Programming Doesn't Suck
I’m here to tell you that visual programming, and diagrammatic reasoning in particular, is a formidable tool-set if used the right way. That is, it only seems to work well if based on a solid foundation rooted in mathematics and computer science. We already abstract our code in order to make it easier to handle — doing it using visual methods such as diagrams is just another way of achieving this.
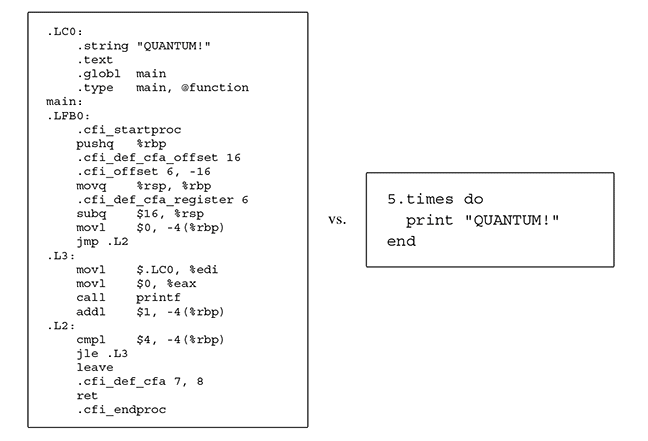
Abstracting from low level code to something that’s easier to reason about. (Bob Coecke’s “Picturing Quantum Processes”) The Drawbacks of What’s Out There
The Drawbacks of What’s Out There
Before you pack up and leave never to return, hear me out. The stigma around visual programming and the ease with which people dismiss it is totally warranted considering most of the tooling that has been around and the way it has been used.
To begin with, drag and drop tools have been a major source of frustration for me personally and seem to be the thing that gives visual ways of programming a bad name. For example, in the context of building a website, using drag and drop instead of, let’s say a Node.js stack, severely impedes the programmer’s work-flow. Also, tooling they’re accustomed to can’t be used properly.
Additionally, the amount of freedom and control one has is considerably reduced. This is the typical example of how visual programming fails. There are plenty more examples of clunky drag and drop UIs which try to make things easier but end up over complicating things and eventually break down. This happens because complexity can’t be managed due to a lack of proper structure.
The pros and cons don’t seem to work out positively and one is left with a poorly constructed abstraction which removes some lower level complexity at a severe cost most programmers simply don’t want to pay. In some situations drag and drop tools may be a good solution for people without programming experience but professionals run from it like the devil. If you’re one of these people, I commend you for getting this far and not leaving as soon as you read “Visual Programming” in the title.
What is Diagrammatic Reasoning
Diagrammatic reasoning is about abstracting unnecessary detail in a particular context in order to focus on details you actually care about and often ease the formation of intuitions. This improves one’s ability to reason about things in a particular way. One example is the encoding of a video. We don’t watch “0”s and “1”s which encode the video — that would be silly.
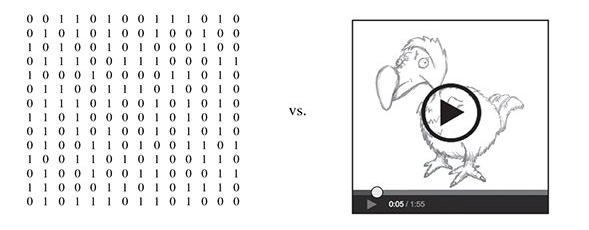
Binary encoding of a video vs the visual representation. (Bob Coecke’s “Picturing Quantum Processes”)
The main thing to realize is that “visual programming” doesn’t necessarily mean a “drag and drop”. Visual programming done right is based on diagrammatic reasoning and proper mathematical formalisms which result in a very robust tool-kit the programmer can wield to their advantage. When I say “diagrammatic reasoning”, I am referring to state machines, Petri nets, string diagrams and category theory in particular, although there are other well defined mathematical formalisms which can be used. Explaining what these are is completely out of the scope of this blog post but I have included a short selection of resources which you can refer to at the end of the post.
More Examples
Instead of explaining the math behind it, I would like to give you some powerful examples of how hiding lower level details by using a visual approach brings forward insights which are more often than not completely opaque to the observer. One of my favorite examples is in Bob Coecke’s book “Picturing Quantum Processes” where he shows the reader that describing quantum processes can be done in a “formal way” (properly defined in terms of mathematics) via the use of several diagrams rather than a page full of obscure characters which have no clear intuition about them and require a much larger amount of prerequisite knowledge to be understood. Check out the diagram below.
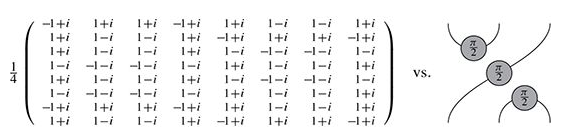
Low level language vs high level language (visual) of describing a quantum process. (Bob Coecke’s “Picturing Quantum Processes”)
This example doesn’t map directly on to programming so let’s try something different. The caveat here is that we need to understand some diagram semantics to make sense of this but what follow is the Fibonacci sequence written in JavaScript and an equal representation as a diagram.
function fibonacci(num){
  var a = 1, b = 0, temp;

  while (num >= 0){
    temp = a;
    a = a + b;
    b = temp;
    num--;
  }

  return b;
}
Fibonacci sequence expressed as a signal flow diagram (Pawel Sobocinski’s blog — Graphical Linear Algebra)
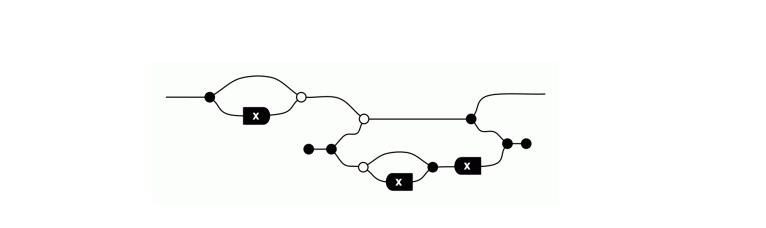
Here is an example of a practical application of a visual approach of modelling a process. Think of an ATM, and since I’m a fan of blockchain technology, a Bitcoin ATM. From a technical perspective this is a machine which has to be designed carefully in order to do the exact thing it’s supposed to by avoiding illegal states. Examples of illegal states could be double dispensing of money, sending the user the wrong amount of crypto currency, or none at all, and so on.
I’ll leave it to you to figure out how you would go about building this type of system with your existing knowledge and present a diagrammatic way of doing it instead. Let’s take the example of exchanging Bitcoin for regular currency. This will be a simplified version of what it would look like in a real setting but it will serve well for demonstration purposes.
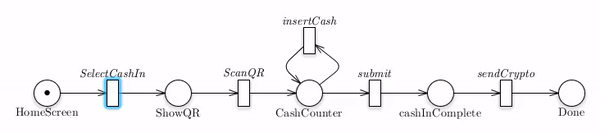
Process for an ATM converting regular money to Bitcoin.
The diagram above is a simple Petri net. The little black dot traveling around is a “token” which represents the current state of the Petri net. As you can see, this is not just a diagram, it’s one that can capture different states by “firing transitions” (the little rectangles are transitions). The interesting thing is that because Petri nets are well structured, one can compile the diagram above into a lower level language to run as a program which interacts with multiple micro-services and/or modules. This is exactly what we are doing at Statebox. Take a moment to compare the approach you would usually take to design a process, to the advantages you may gain from using a visual approach of modelling the architecture (in this case of a process) for a piece of software which runs in a Bitcoin ATM.
Some advantages that naturally come from using a visual approach to modelling processes:
- It’s easier for non-technical people to contribute to the modelling of the process in a meaningful way
- The surface area for errors is reduced (on the process level)
- One gets access to mathematical tools which can be applied to Petri nets, such as state space analysis to detect dead locks and prevent illegal states
- It’s easier to be sure all edge cases and errors have been addressed because diagrammatic reasoning helps us abstract from low level information (for example, the equivalent of the diagram above written out in plain English or conditional statements is a lot harder to reason about than the nice visual representation we have here)
- Building UIs based on the different states of the process — this makes it easier to manage the complexity of matching state of the system with what’s being shown in the UI and has a nice synergy with reactive programming.
- Although not necessarily an exclusive property of modelling things visually, having a structure such as a Petri net is able to manage complexity as it has a lot of information embedded into it (such as the set of legal “next” states). Consequently, this doesn’t have to be addressed in code and often simplifies APIs and middleware.
Different “Levels” to Consider
A thing to keep in mind is that visual programming doesn’t have to be about implementing low level logic such as interaction with third party services, APIs. The effective way to use it is to model things on a higher level instead (higher level can be a bit misleading here because it can refer to high level system architecture or a lower level process such as the one above which runs in an ATM).
Final Note
This blog post was modified from the original version which I wrote while working on Statebox. You can find the original here. If you found this blog interesting, Statebox has been working on creating an ecosystem of tools which focus on graphical approaches to programming while leveraging formal methods from different branches of mathematics and computer science - very exciting and interesting stuff, and I highly recommend checking it out.
Resources
For more insight into quantum computation, graphical algebra, and category theory.
- Pawel Sobocinski’s blog about graphical linear algebra — I recommend starting from Episode 1 and skipping any sections you are familiar with. Pawel does an amazing job of taking one from basically 0 understanding of visual algebra and category theory to being able to reason about both and understanding the relationship between the two in an intuitive way by using diagrams and building up the complexity of the semantics over time.
- 7 Sketches in Compositionality by Brendan Fong and David Spivak — This is an amazing book about category theory and compositionality explained through real world problems in a way that doesn’t require prerequisite knowledge. It’s designed so as to not build too much on itself so that each section makes sense separately.
- Bob Coecke’s Picturing Quantum Processes — an amazing book about using visual approaches to understanding quantum theory.